
Use of non linear techniques such as Conditional Sampling and Continuous Wavelet Analysis to detect the atmospheric structures.
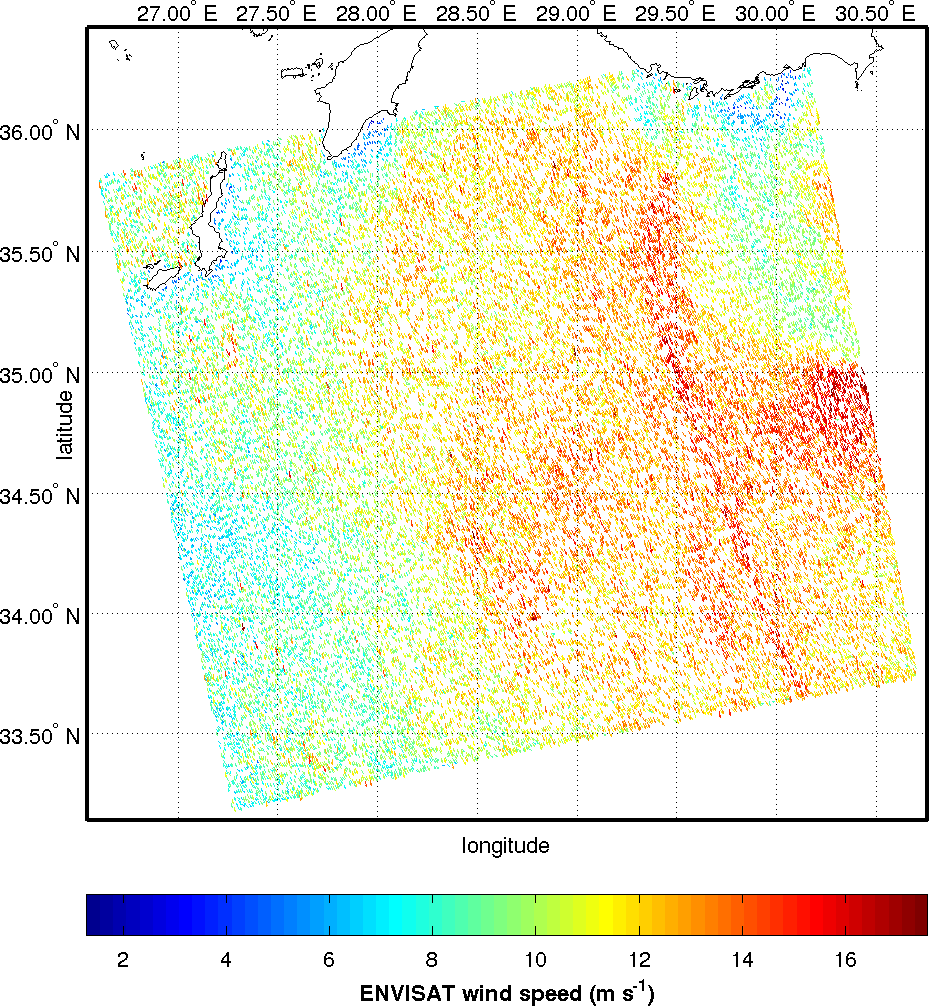
The wind field over SAR images may be derived using a methodology based on the two-dimensional Continuos Wavelet Transform (2D-CWT). In Fig. 2, an Envisat SAR Wide Swath image (ASA_WSM_1pndpa20021020_195918_000000672010_00286_03346_0001, 20 October 2002 19:59 GMT), taken by the Advanced Synthetic Aperture Radar (ASAR) of ESA in the eastern Mediterranean Sea, is shown in the left panel. In the top left of the figure are visible the islands of Karpathos and Rhodes, while in the top right corner the south-western part of the Turkey. The central panel shows the structure of the atmospheric cells derived after the 2D-CWT analysis, while the right panel reports the wind field derived, once determined the wind directions through the 2D-CWT technique, using the CMOD5 algorithm (Hersbach, Stoffelen and de Haan, An Improved C-band scatterometer ocean geophysical model function: CMOD5, J. Geophys. Res., 2007, 112, C03006).
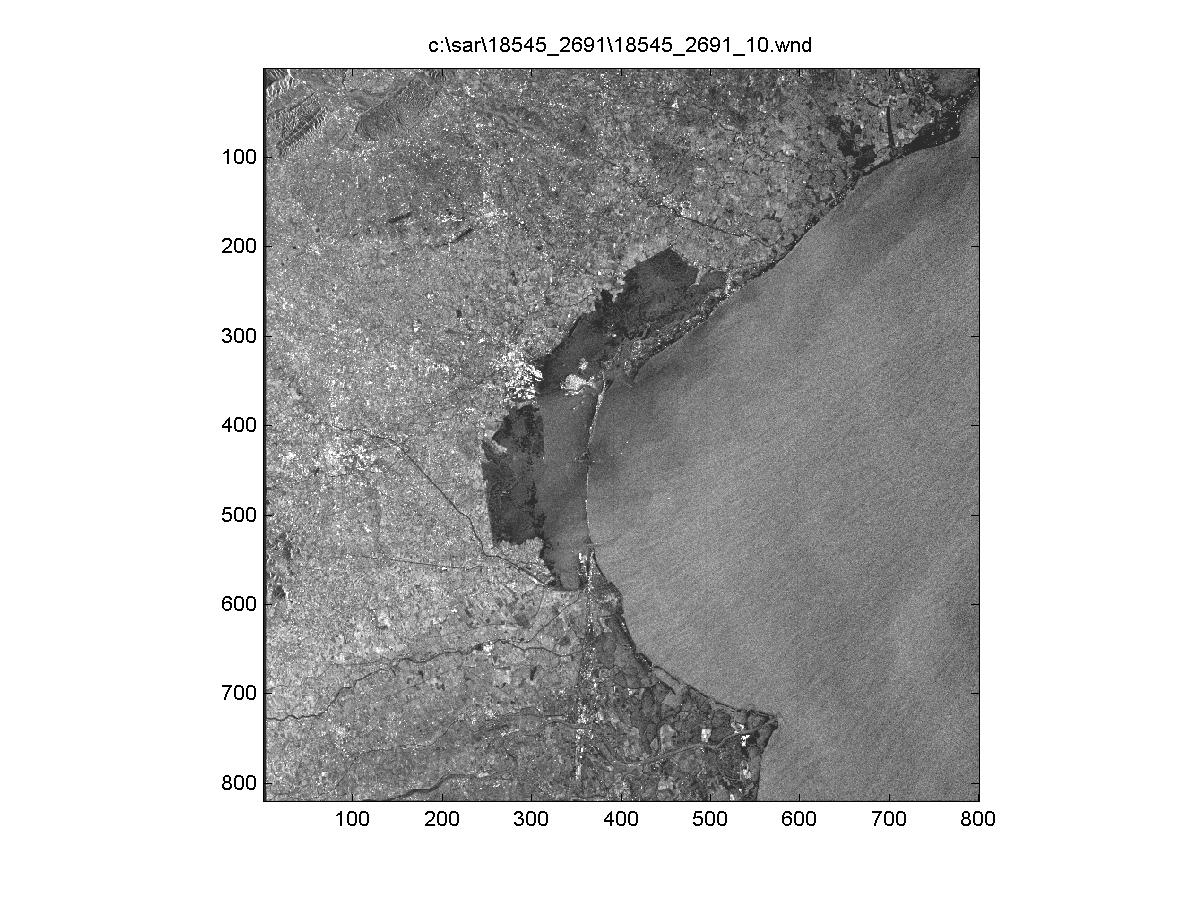
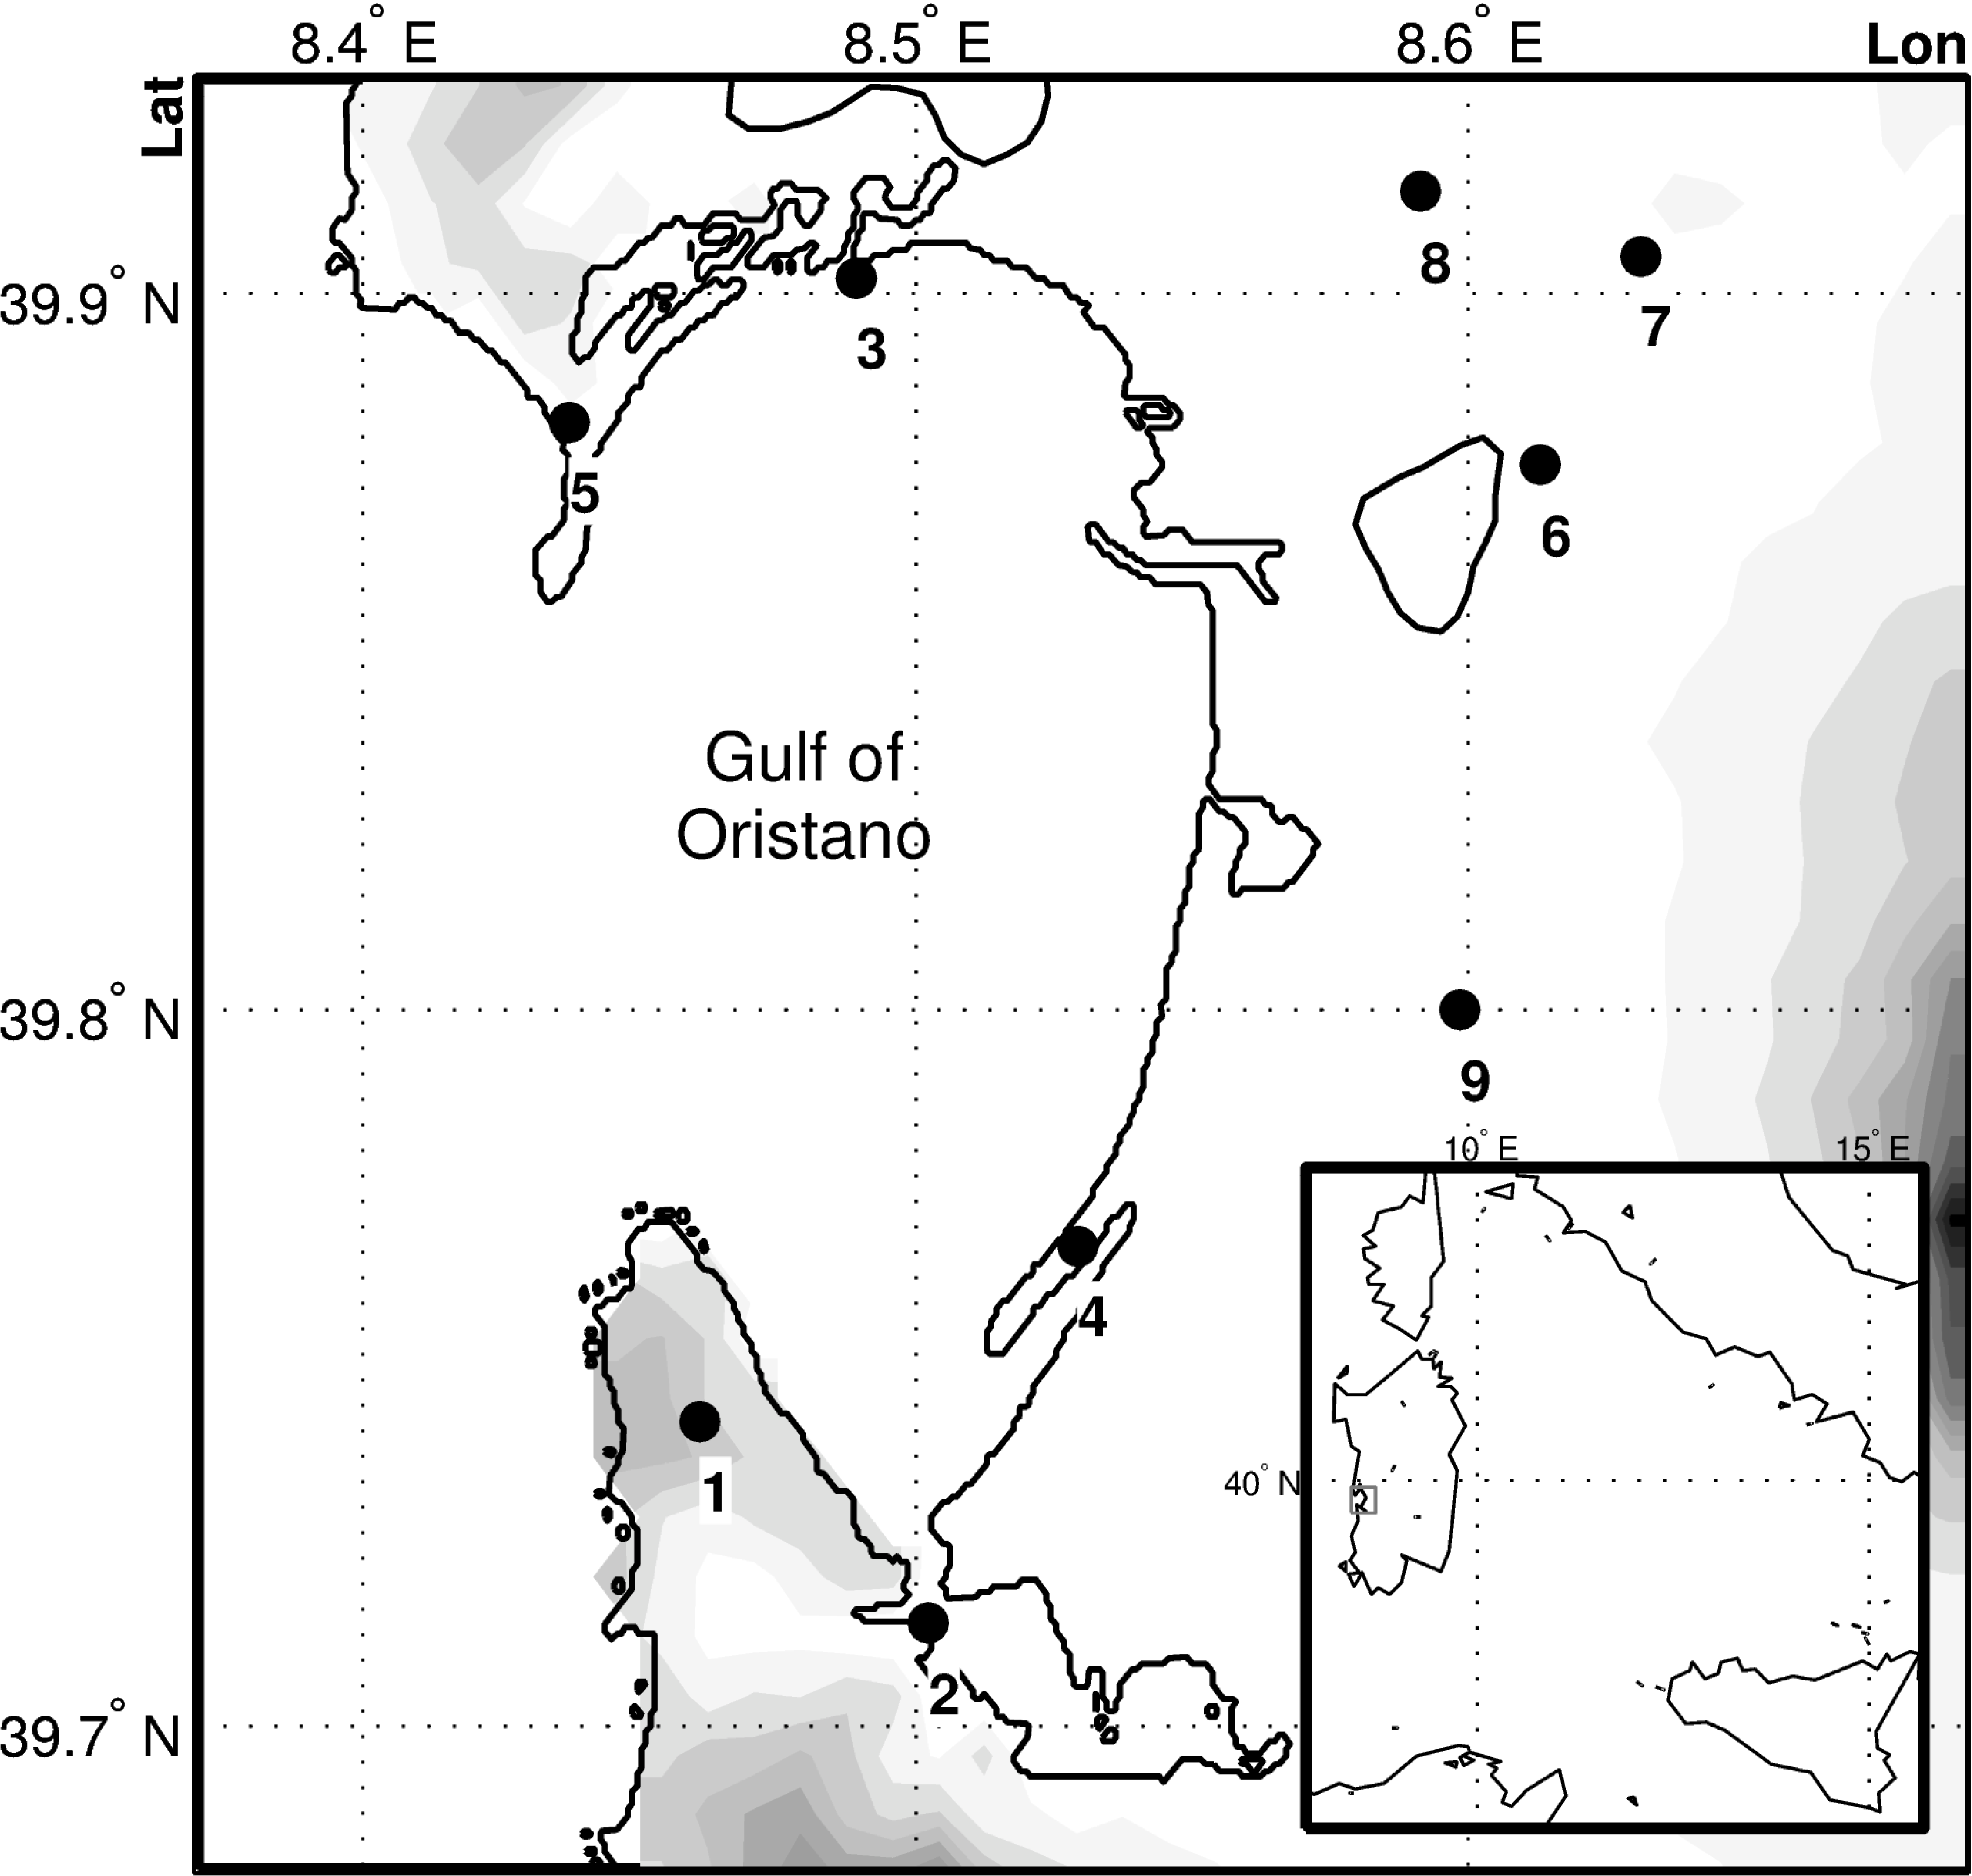
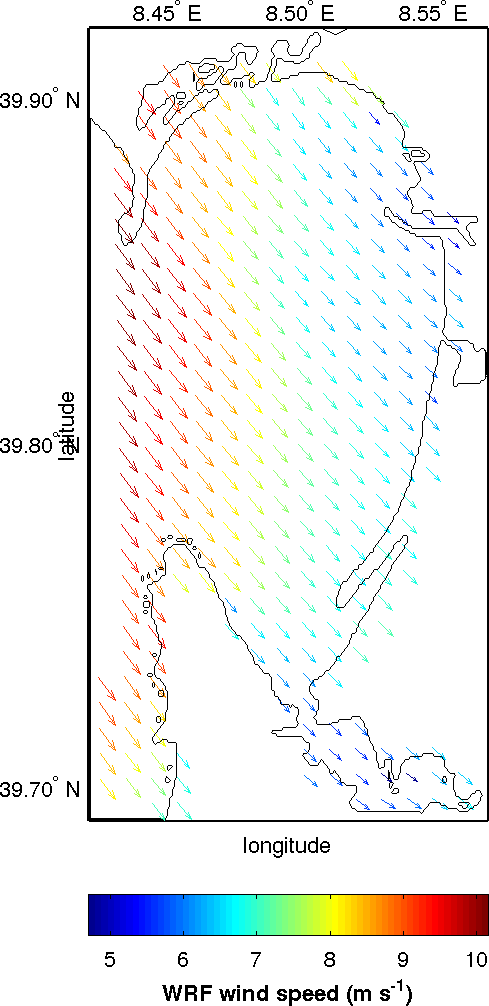
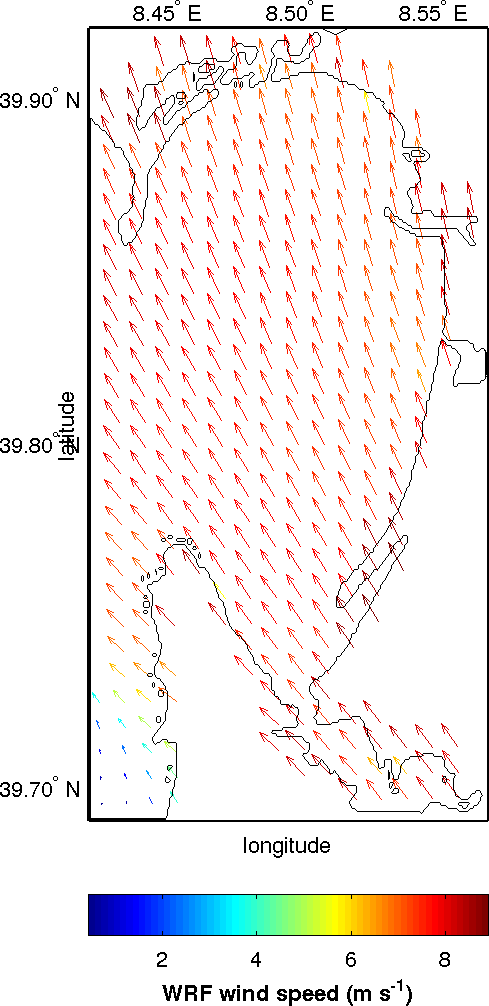
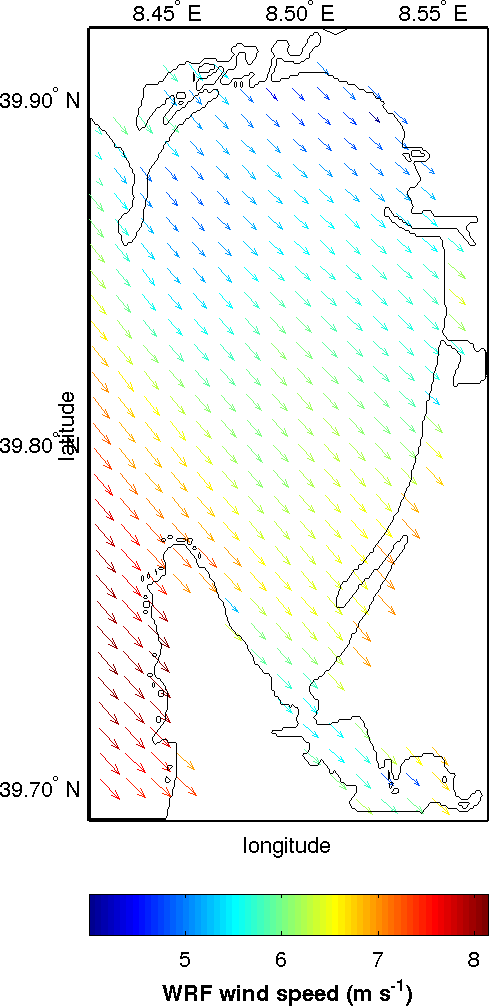
An important use of the SAR derived winds is in coastal areas, not covered by satellite scatterometer data which sense the ocean from about 15 to 30 km from the coasts. For instance, the EUMETSAT Meteorological Operational (MetOp) satellites provide wind data at 12.5 km of spatial resolution from 15 km from the coast. Due to the interaction between the wind flow and the orography, the winds in coastal areas are often not well `reproduced by both global and regional atmospheric models (Accadia et al. 2007, Zecchetto and Accadia 2014). Therefore, the possibility to derive the surface wind field from SAR images is extremely important because it permits to achieve a deep knowledge of the spatial characteristics of the wind. To study these aspects of coastal meteorology, we focused on a small Gulf of Oristano in the eastern part of the Sardinia island, shown in Fig. 3.
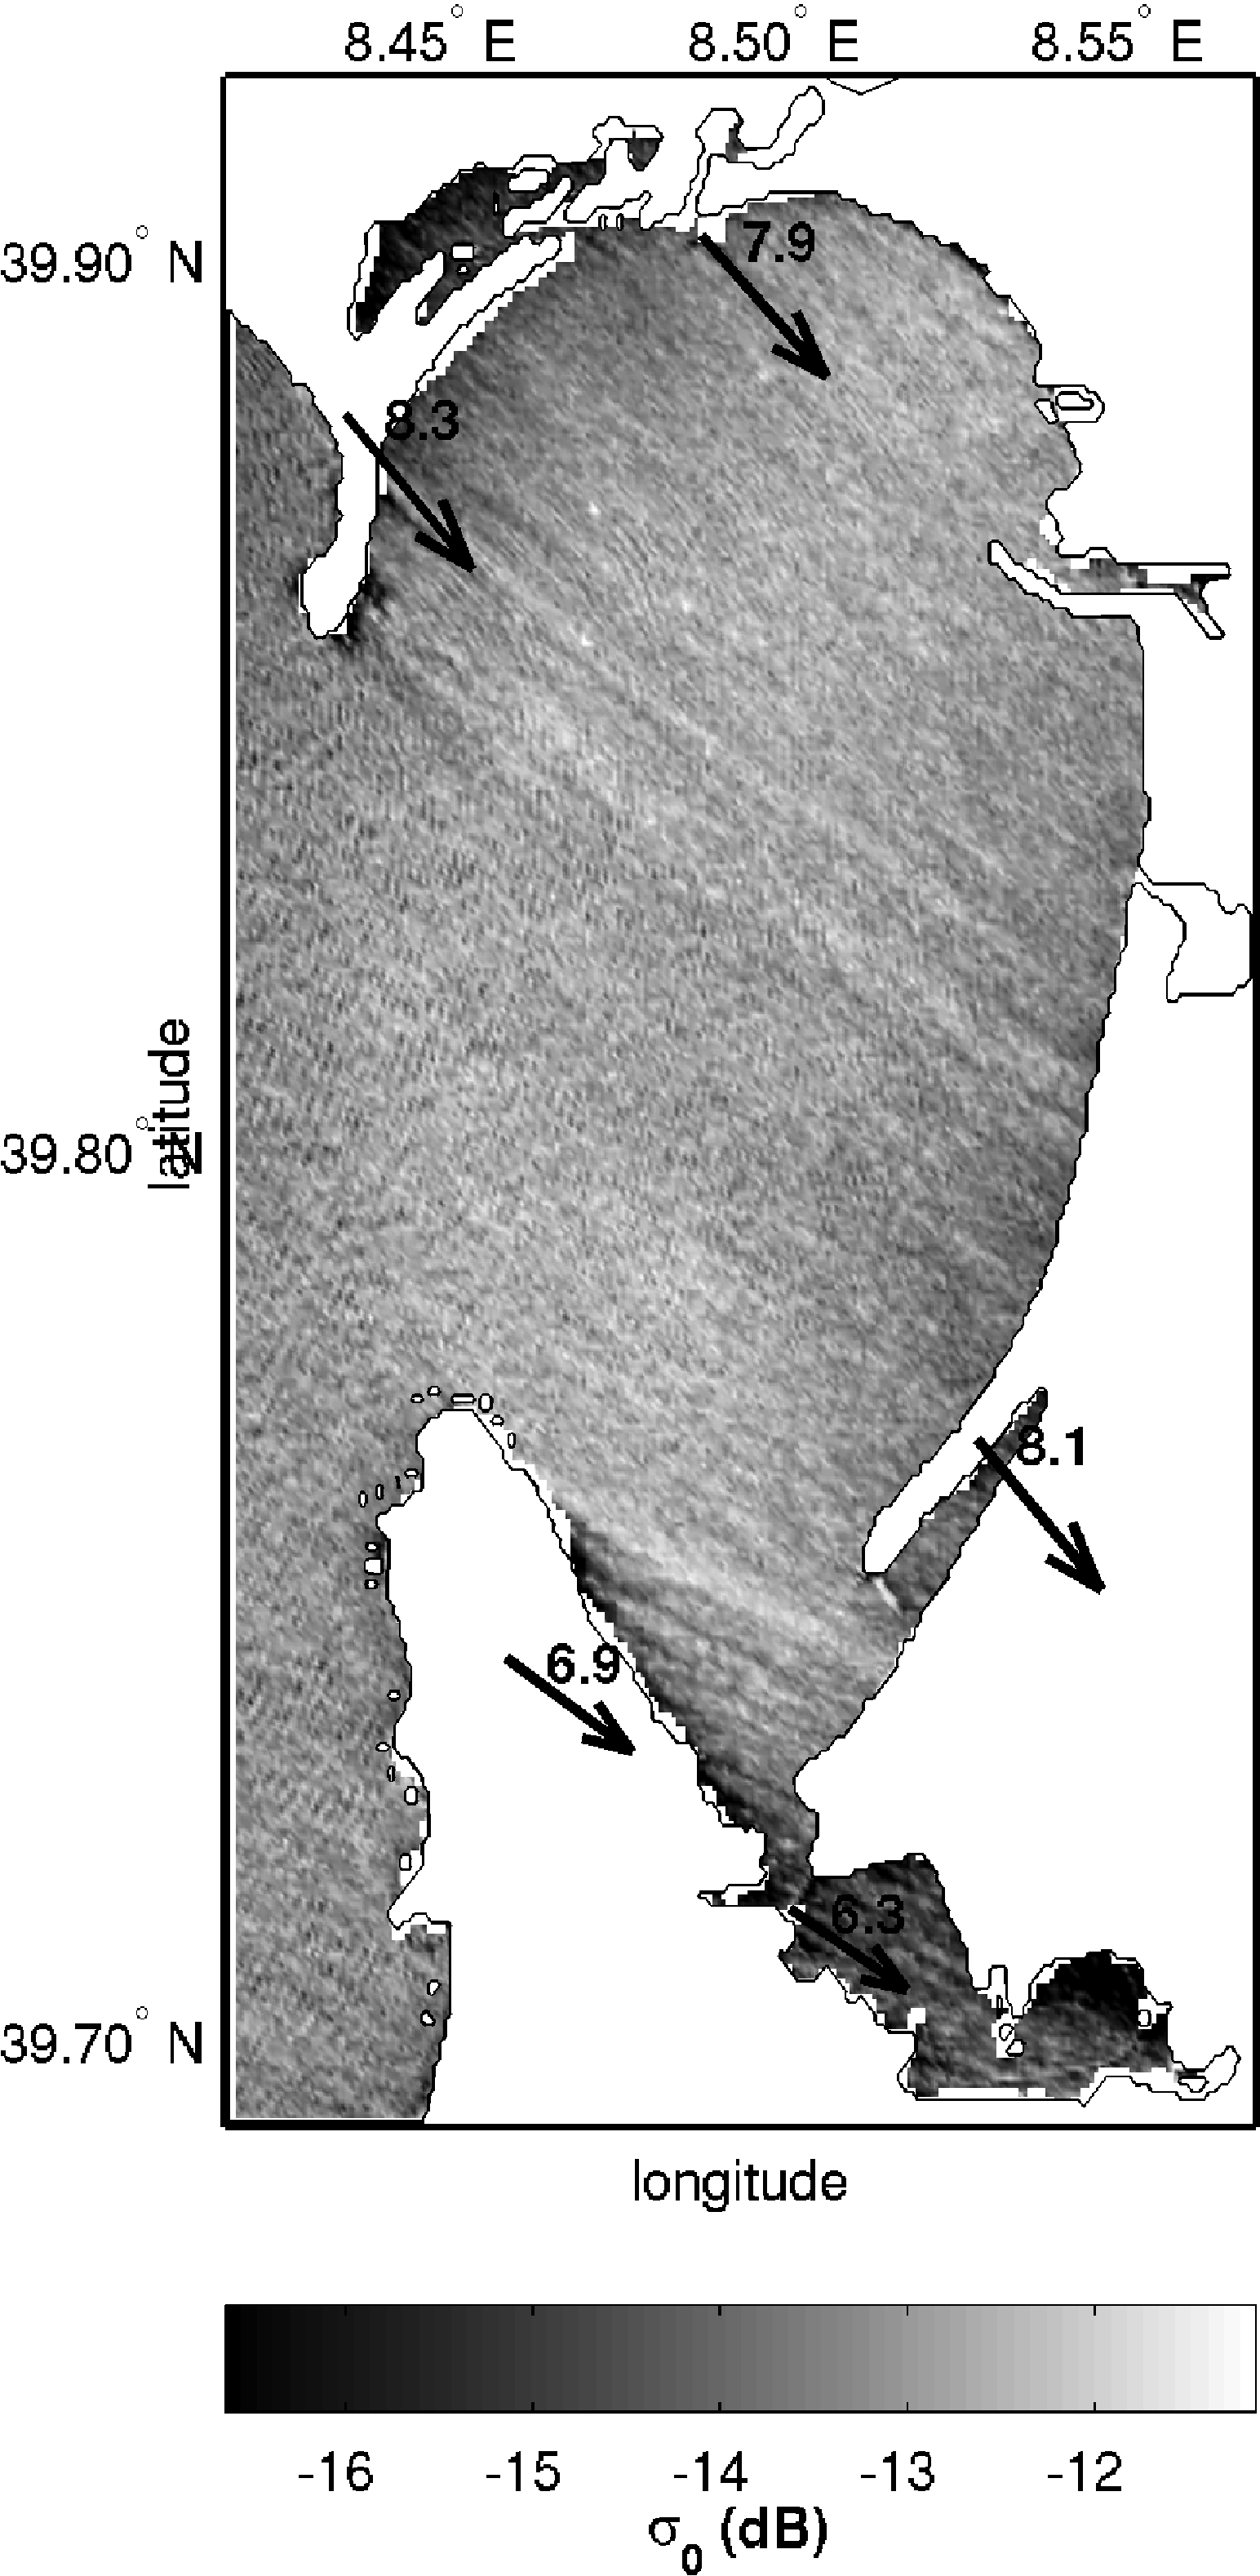
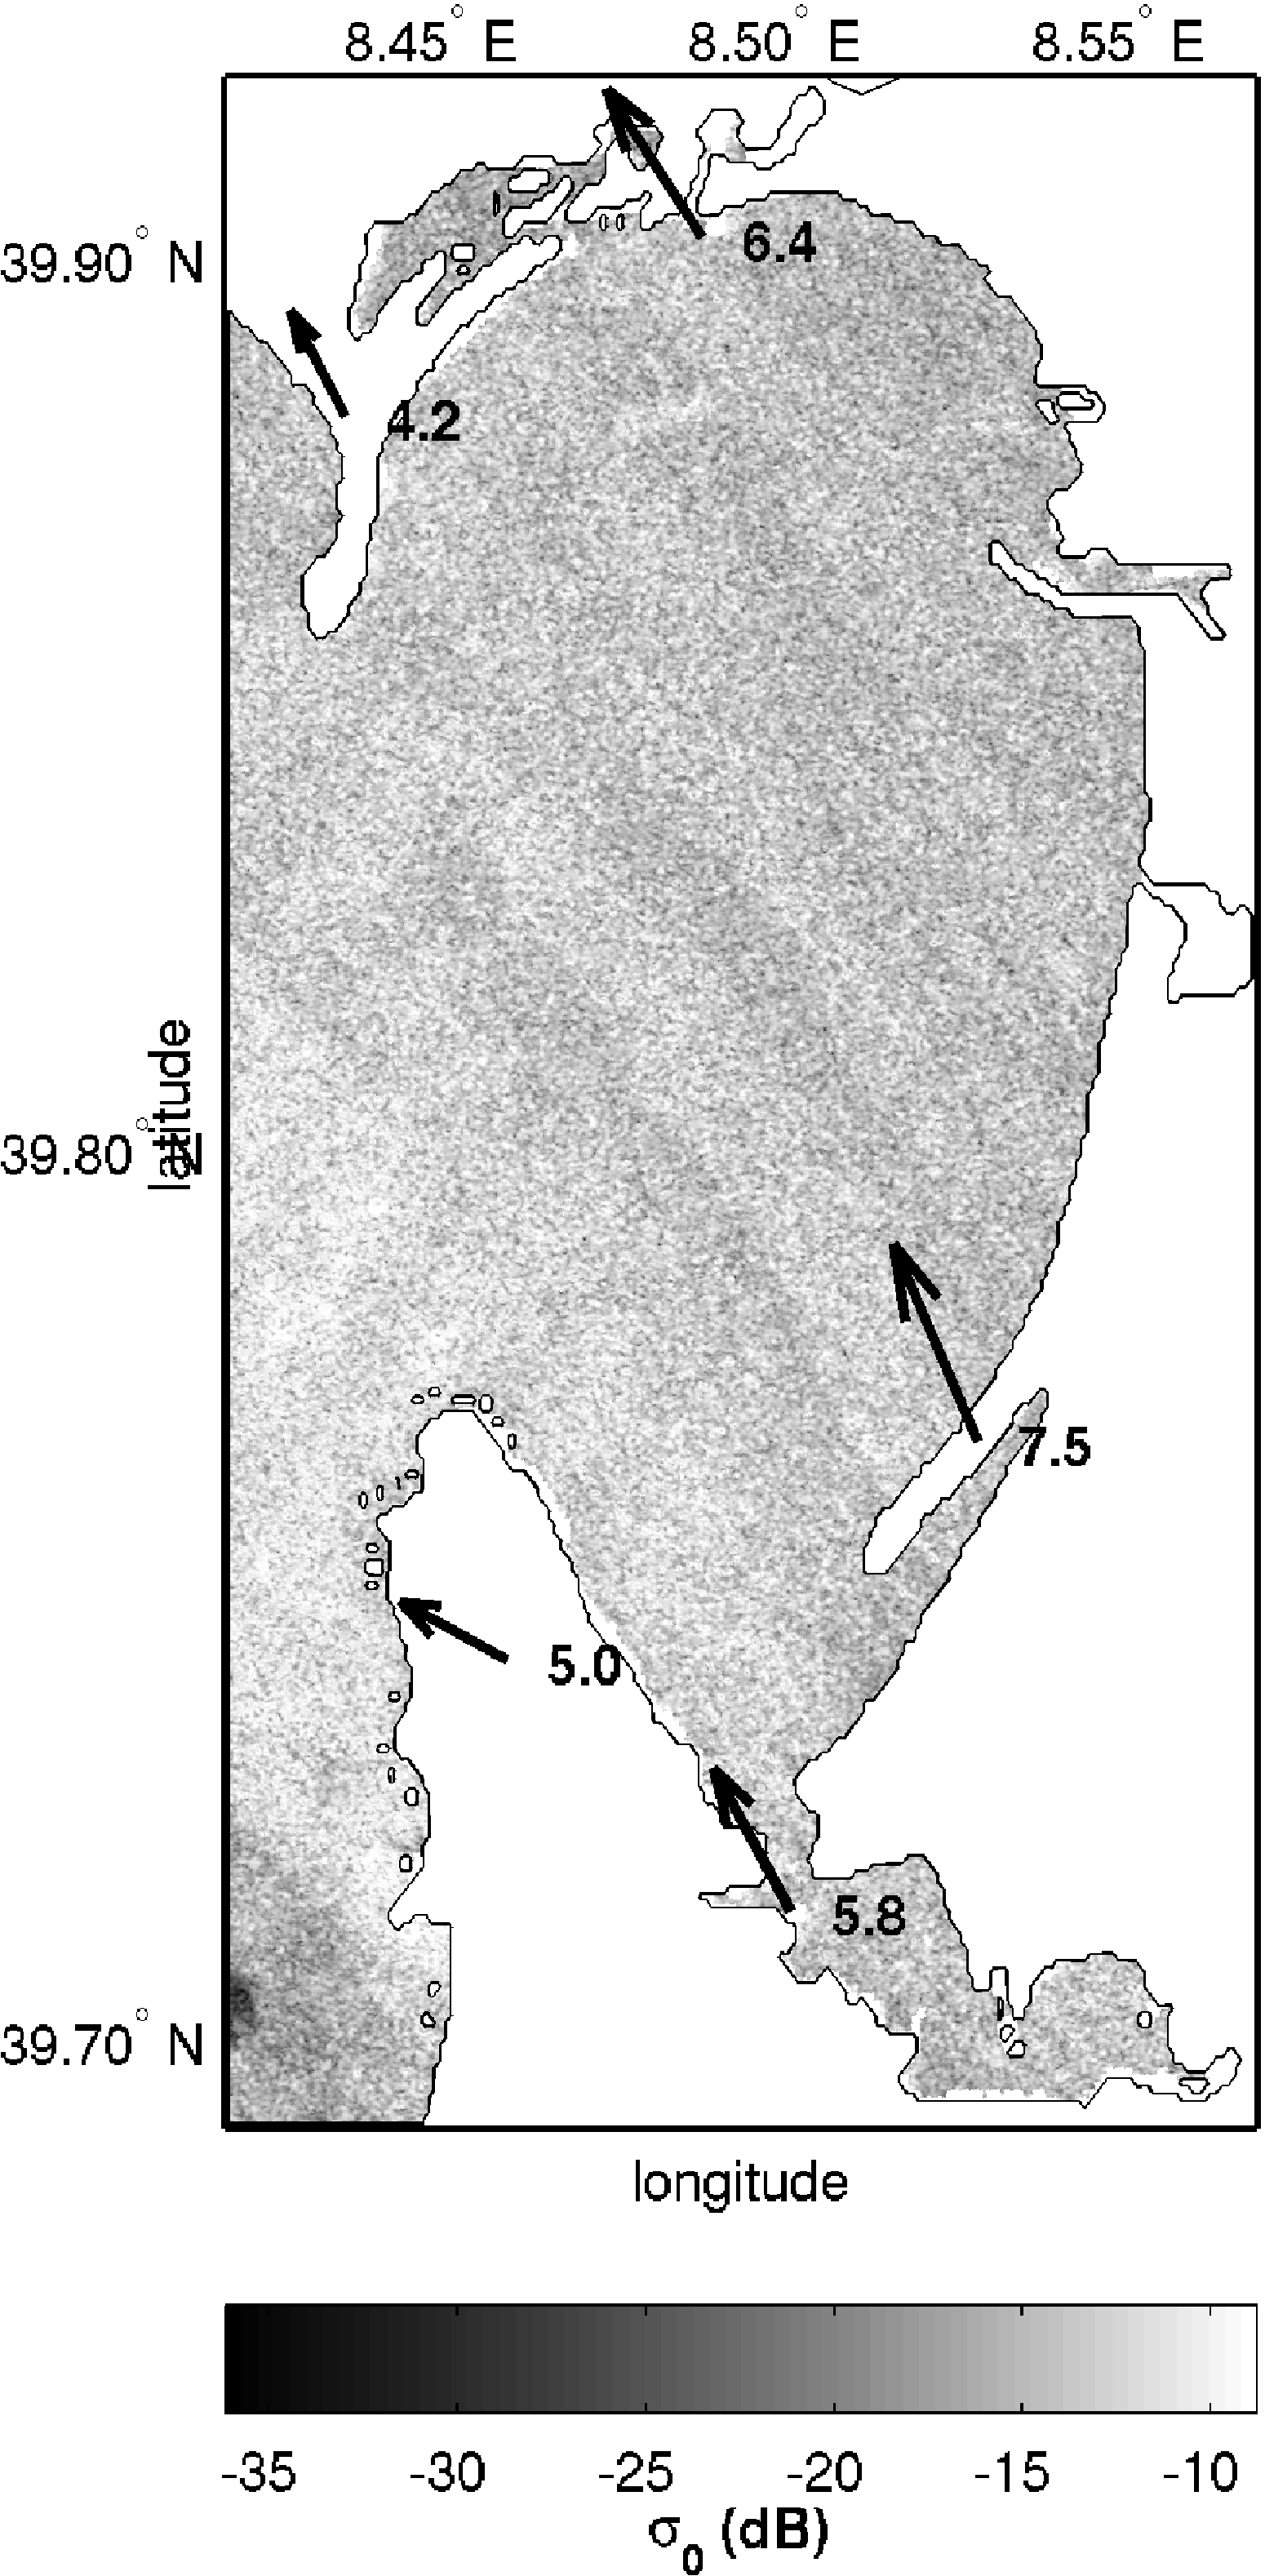
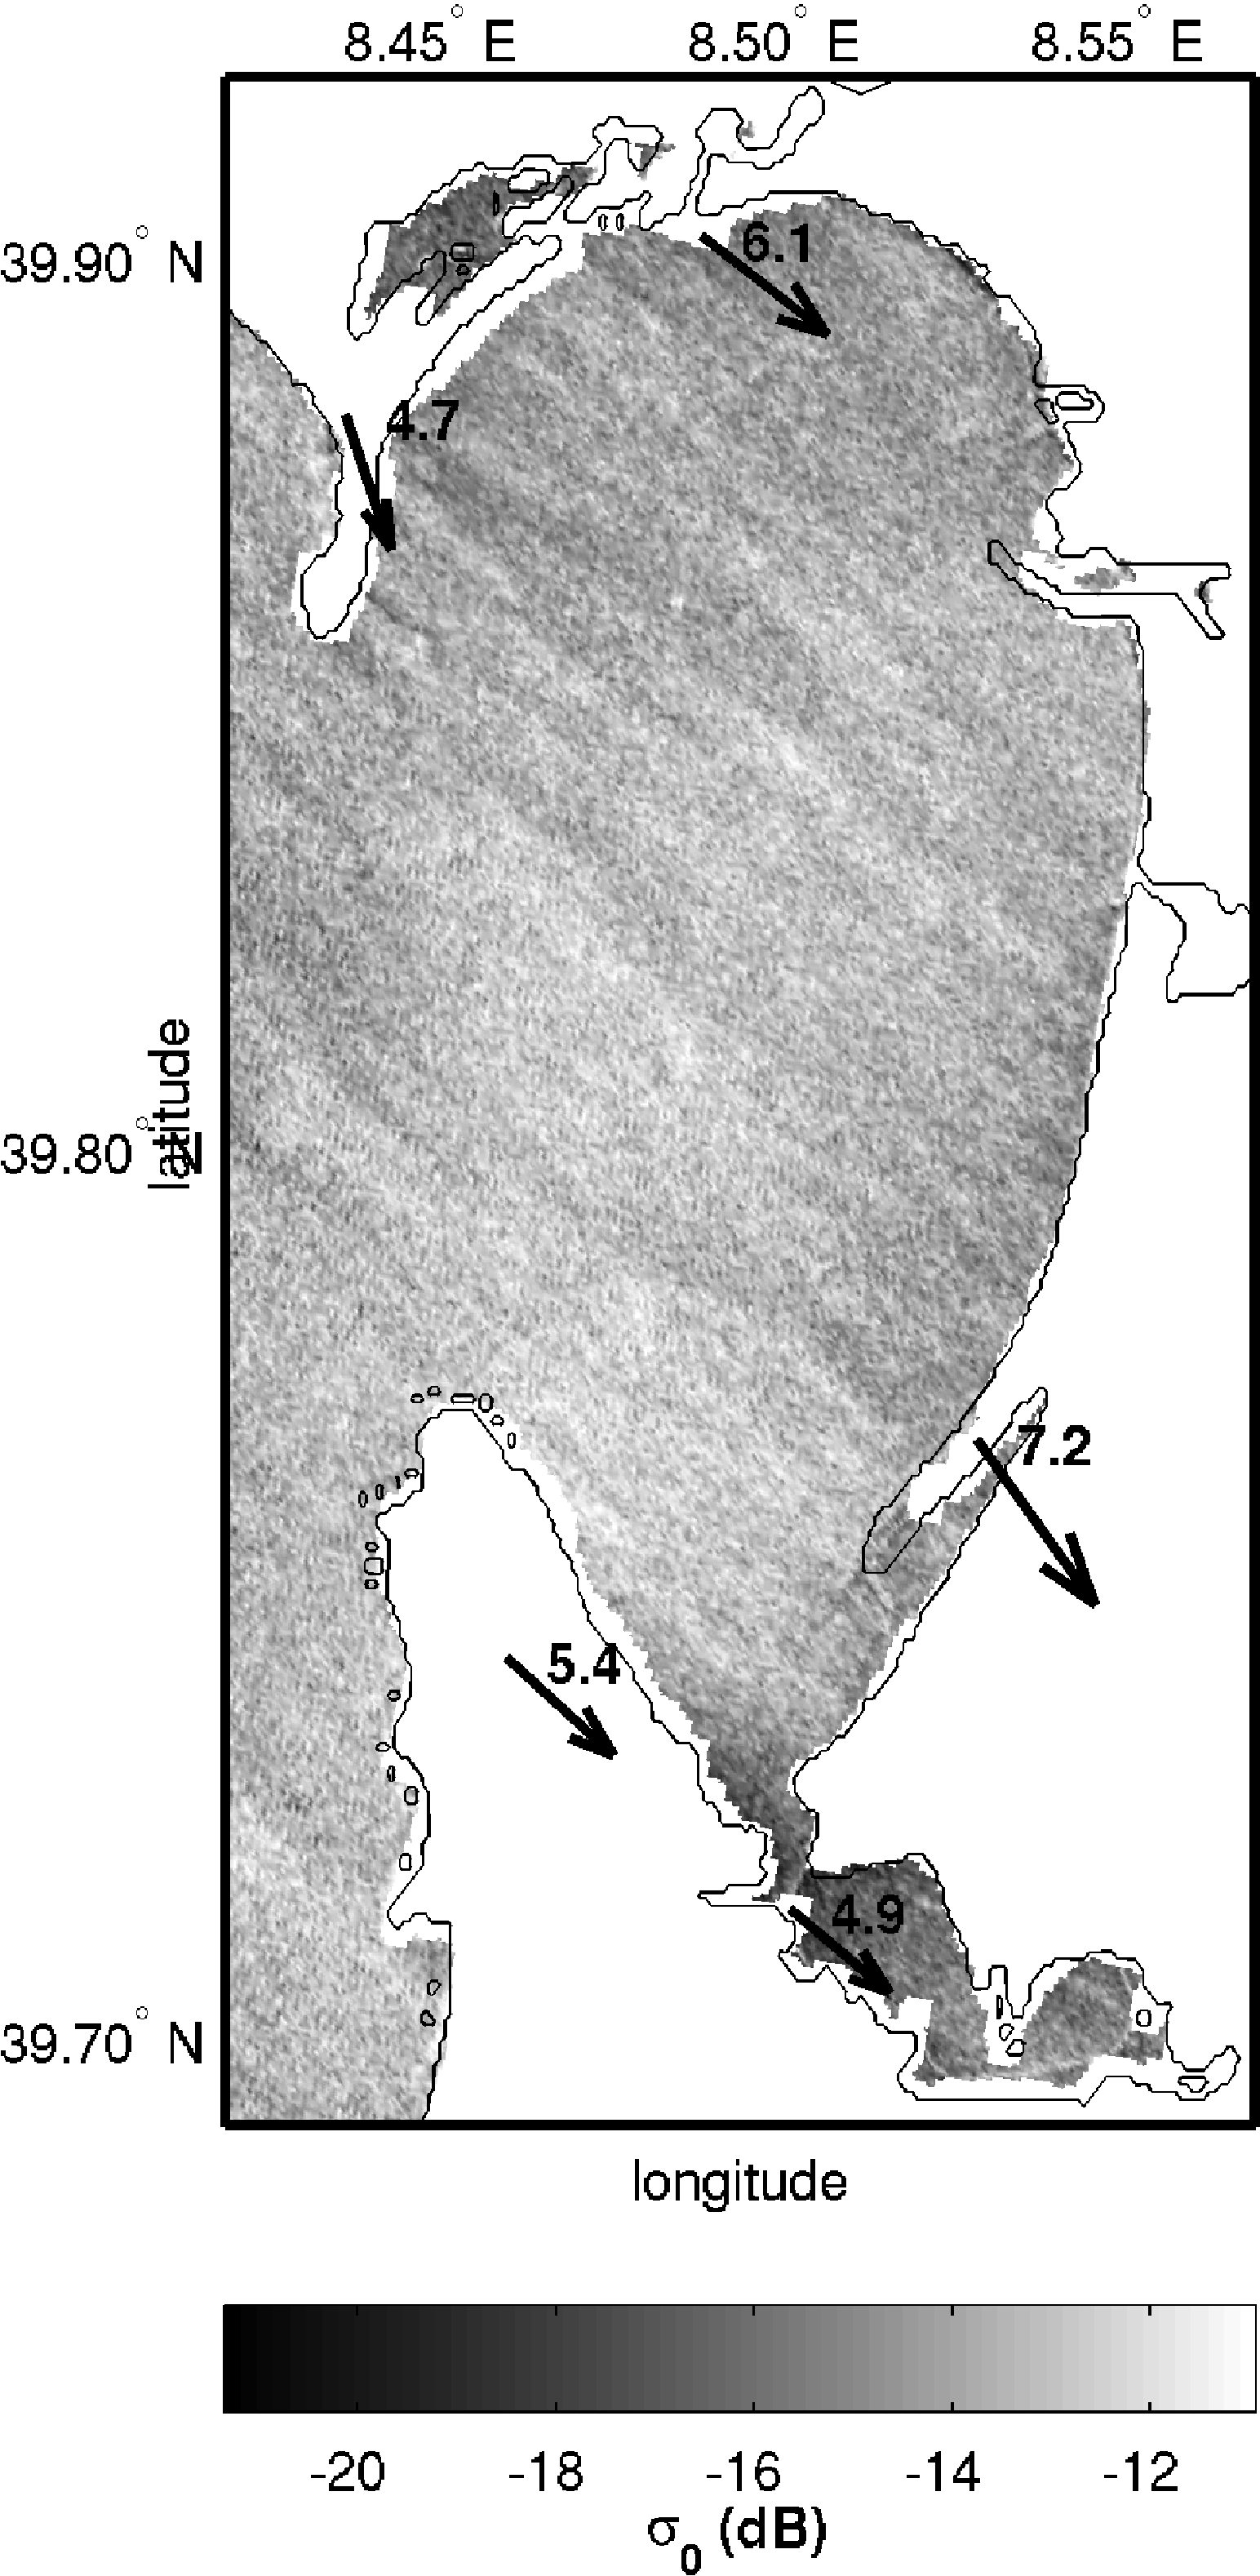
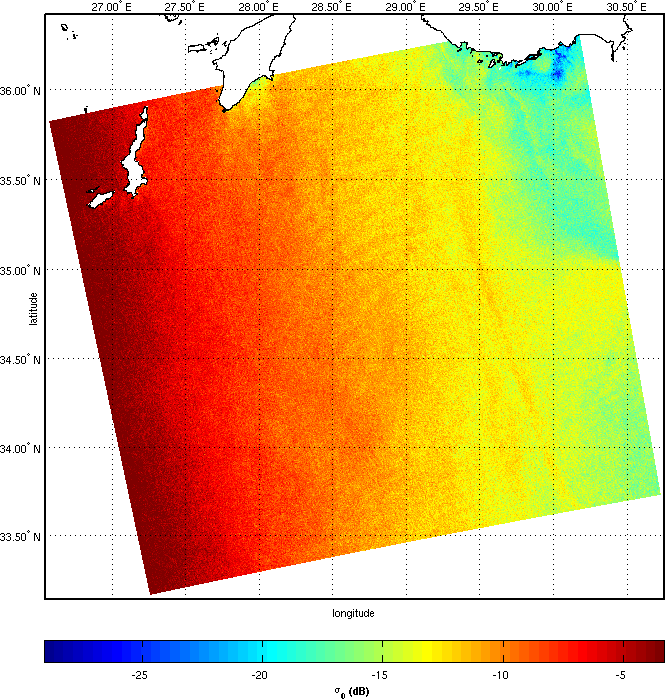
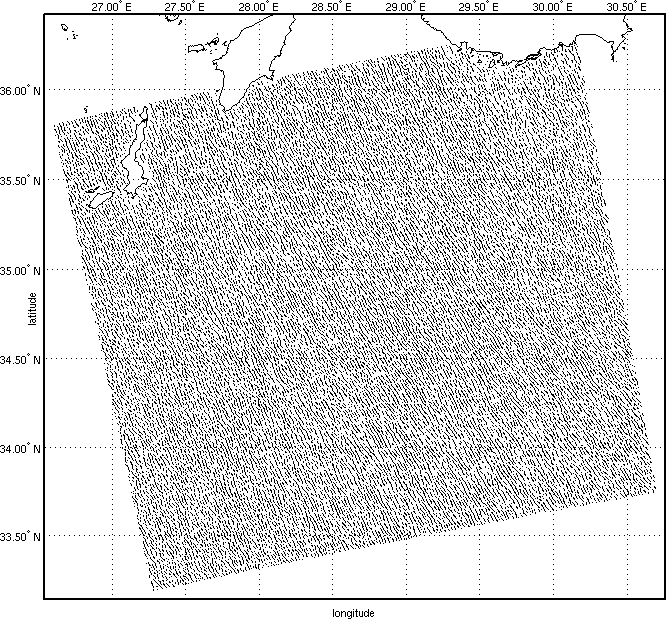
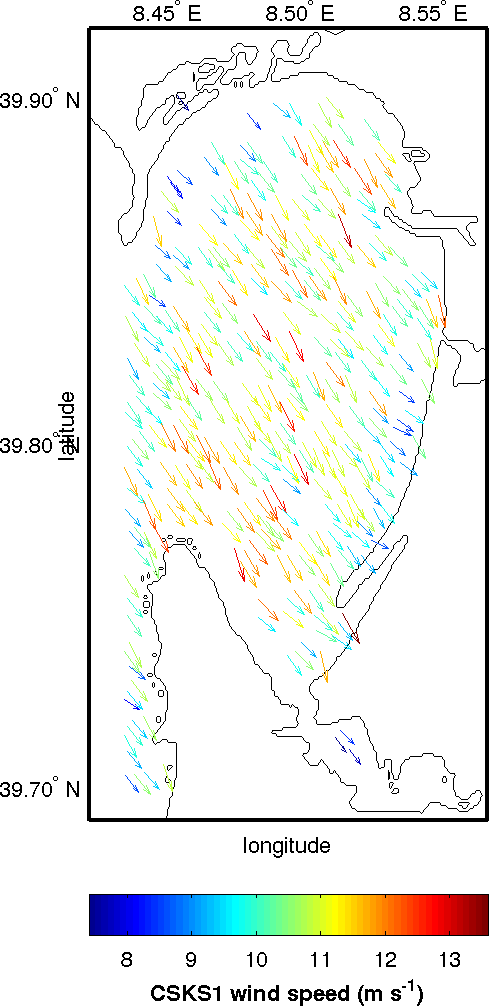
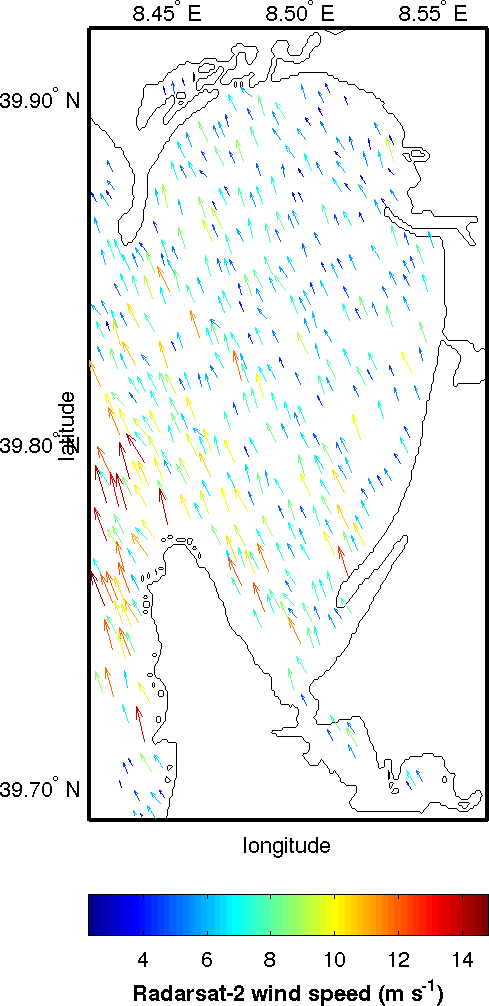
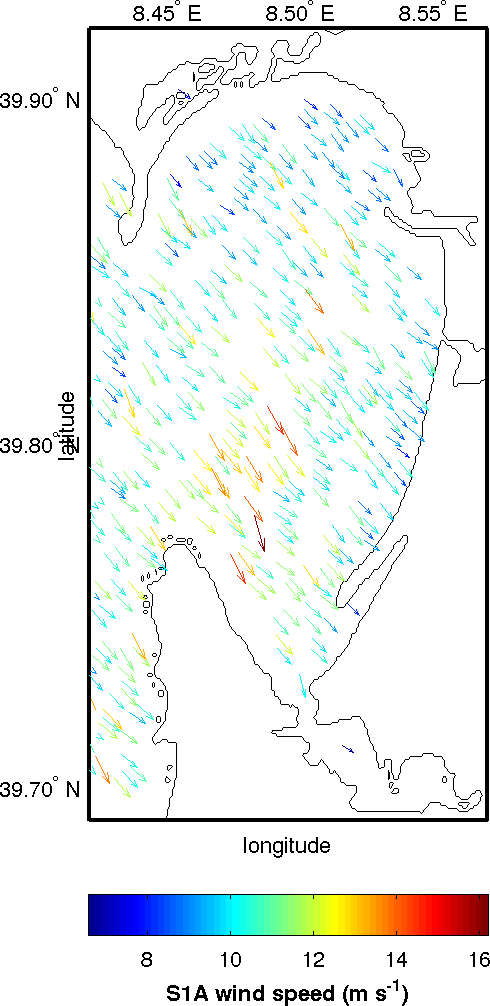
The SAR derived wind fields are in Fig. 5: they have been computed using the CMOD5 model (Hersbach et al., “An improved scatterometer ocean geophysical model function: CMOD5,” Journal of Geophysical Research, vol. 112, pp. 5767–5780, 2007, doi:10.1029/2006jc003743) for Radarsat-2 and Sentinel-1A (C-band) and the XMOD2, developed for the TerraSAR-X satellite (Li and Lehner, “Algorithm for Sea SurfaceWind Retrieval From TerraSAR-X and TanDEM-X Data,” IEEE Trans. Geos. and Remote Sensing, vol. 52, no. 5, pp. 2928–2939, 2014), for COSMO-SkyMed (X-band), once the wind direction has determined by the 2D-CWT method. The radar backscatter values used are the average inside the detected wind cells.
Selected references
Zecchetto S., F. De Biasio, A. della Valle, G. Quattrocchi, E. Cadau and A. Cucco,
Wind Fields from C and X band SAR images at VV polarization in coastal area (Gulf of Oristano, Italy),
IEEE Journal of Selected Topics in Applied Earth Observations and Remote Sensing, 2016 (doi:10.1109/JSTARS.2016.2538322).
Miglietta M.M., Zecchetto S., De Biasio F., A comparison of WRF model simulations with SAR wind data
in a case study of orographic lee waves over the Eastern Mediterranean Sea,
Atmospheric Research, 120-121, p. 127-146, 2013 (doi: 10.1016/j.atmosres.2012.08.009).
Miglietta, M. M., S. Zecchetto and F. De Biasio, WRF model and ASAR-retrieved 10 m wind field
comparison in a case study over Eastern Mediterranean Sea, Adv. Sci. Res., 4, 83-88, 2010 (doi:10.5194/asr-4-83-2010).
Zecchetto, S., Ocean wind fields from satellite active microwave sensors,
in Geoscience and Remote Sensing, New Achievements ( P. Imperatore and D. Riccio Eds.), In-Teh, 2010, ISBN 978-953-7619-97-8.
Zecchetto, S. and De Biasio, F.,
A Wavelet Based Technique for Sea Wind Extraction from SAR Images
Zecchetto, S. and De Biasio, F., Computation of wind field from ENVISAT ASAR WIDE SWATH and ERS SAR images without any a priori information
, Proc. Envisat Symposium, Montreux, Switzerland, 23-27 April , 2007Zecchetto, S. and De Biasio, F., On shape, orientation and structure of atmosheric cells inside wind rolls in two SAR images, IEEE Trans. of Geoscience and Remote Sensing, vol. 40, n. 10, 2257-2262, 2002).
Zecchetto, S. and De Biasio, F. Wavelet analysis applied to SAR images to detect atmospheric structures, Il Nuovo Cimento, vol. 24, n. 1, 2001
Zecchetto, S., P. Trivero, B. Fiscella and P. Pavese, Wind stress structure in the unstable marine surface layer detected by SAR, Boundary Layer Meteorology, 86, 1-28, 1998.