
This activity is aimed to the understanding of the air-sea interaction processes. It requires simultaneous measurements of the sea surface properties as well as of the air turbulence. The sea surface properties are measured by means of microwave coherent radars, while the air turbulence characteristics are derived from measurements of the wind components and air temperature by mean of a sonic anemometers.
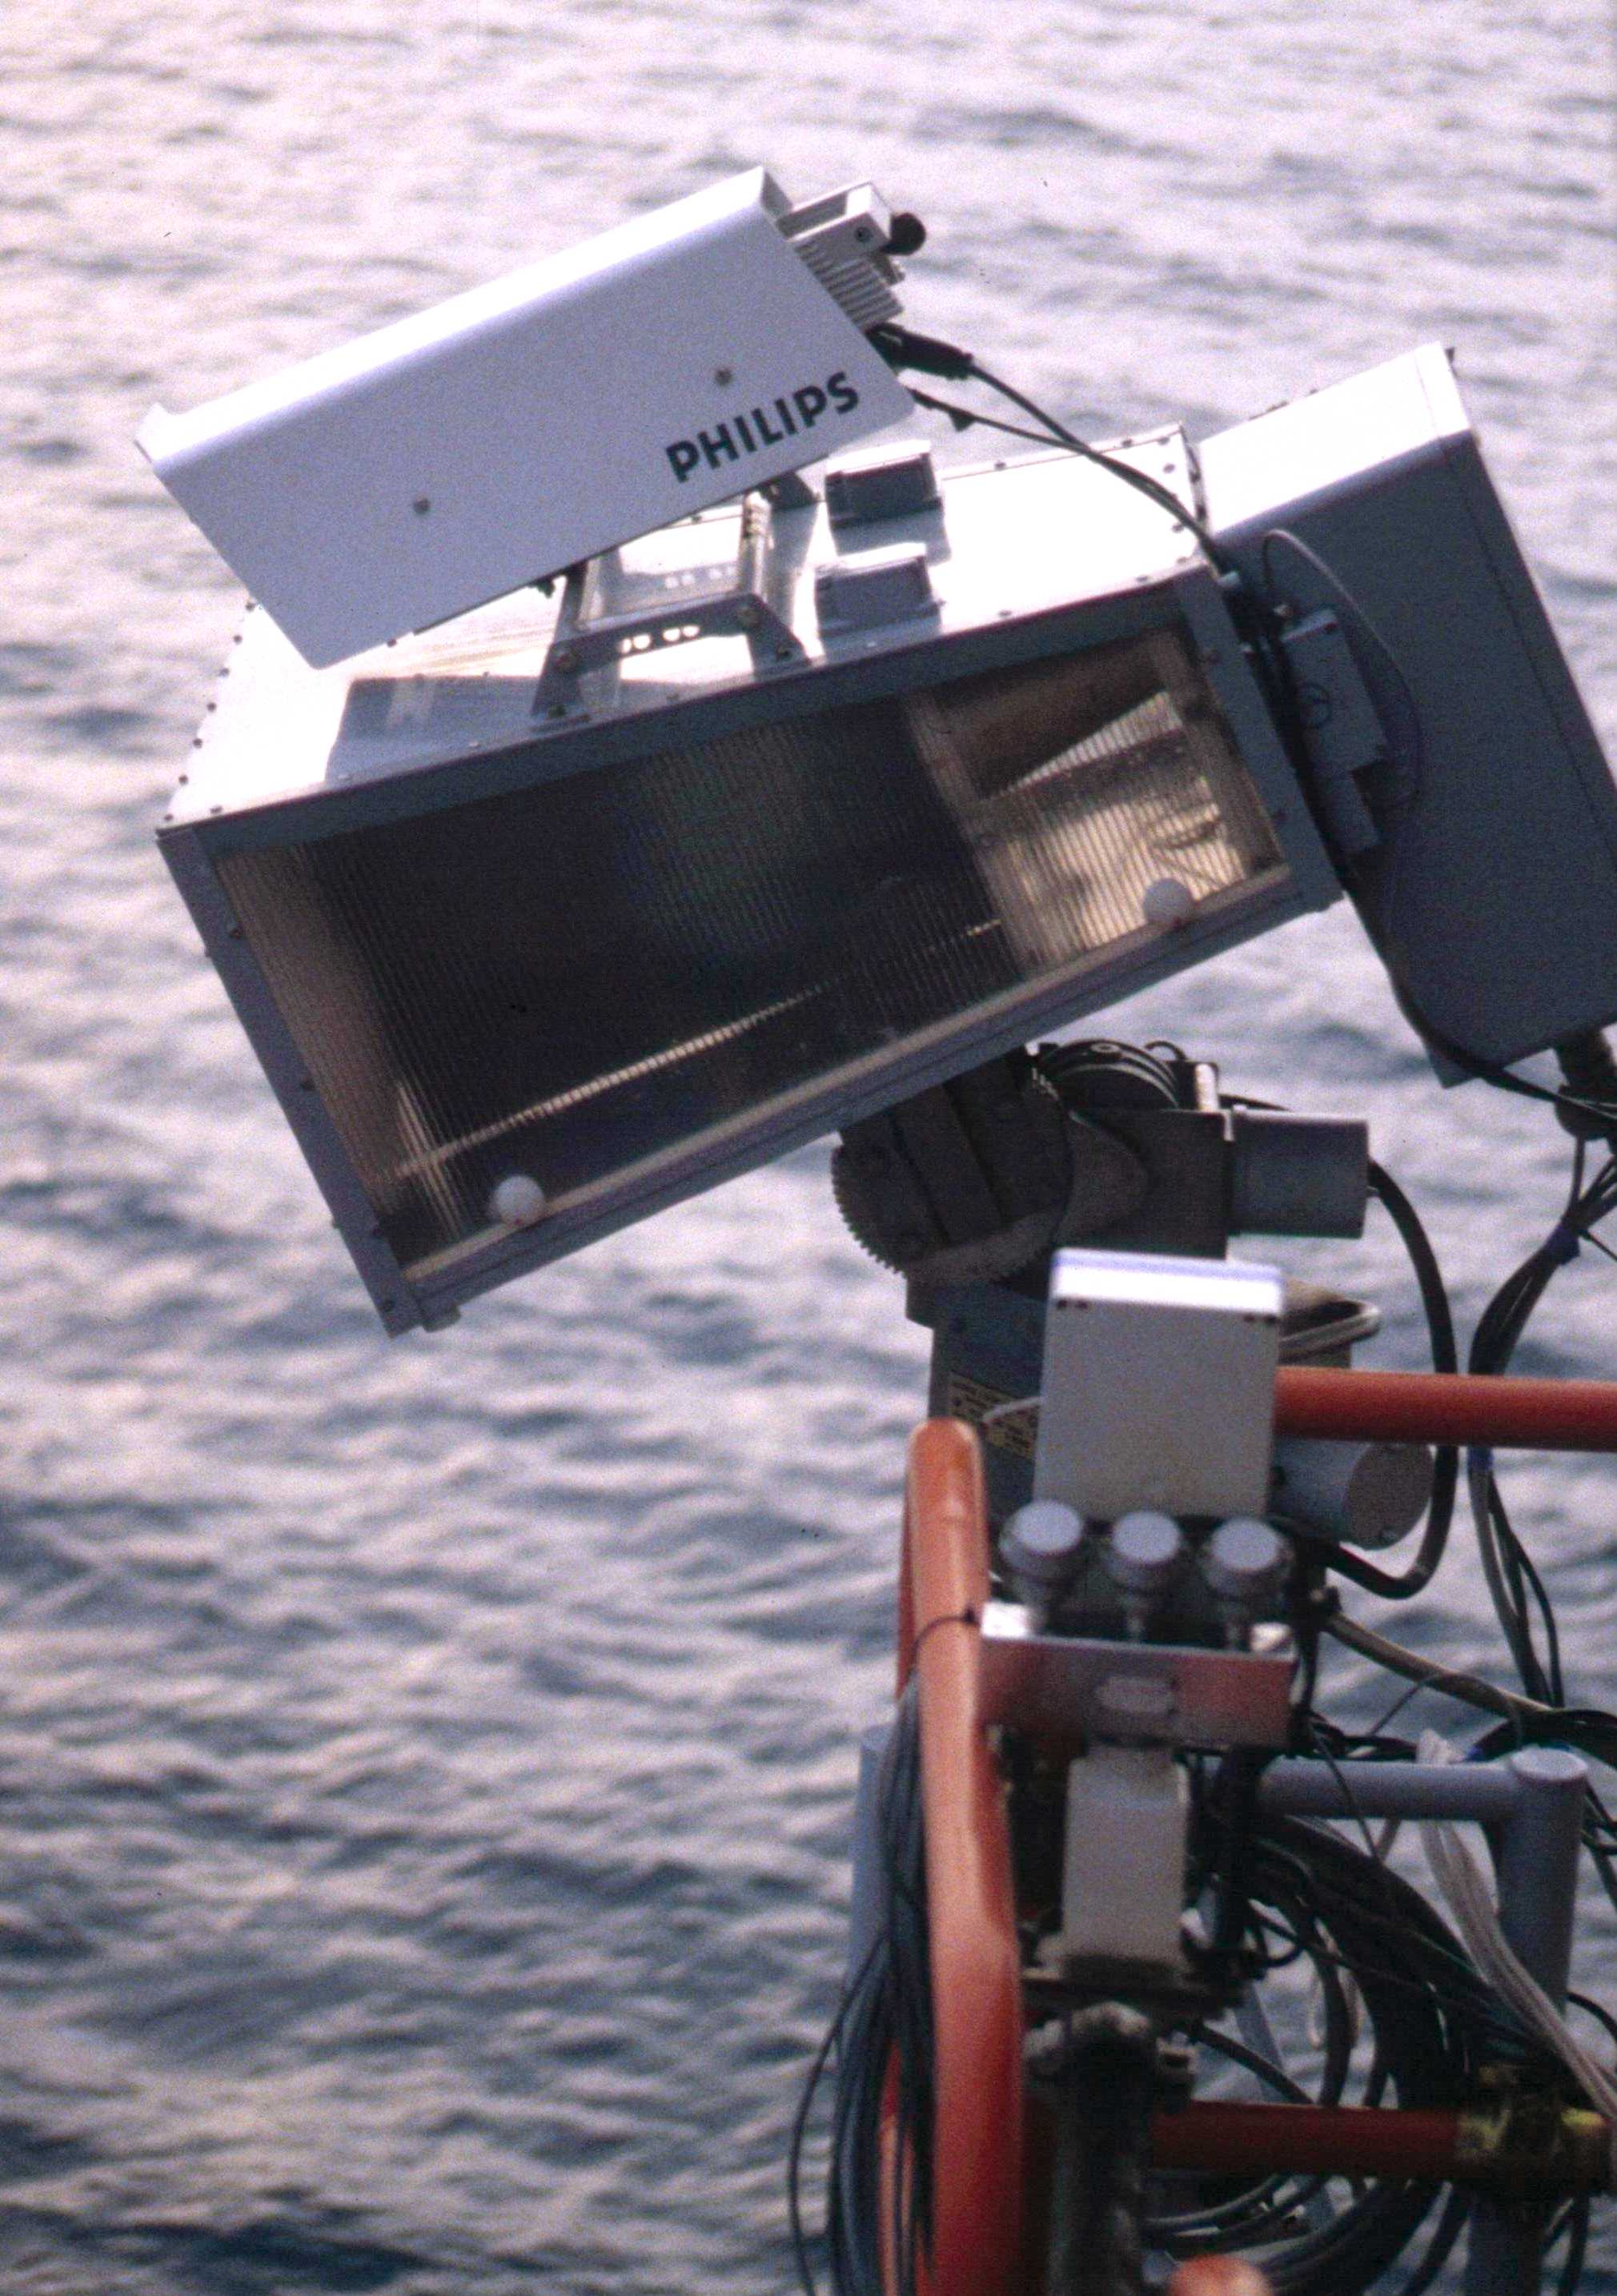

Instrumentation available: radar scatterometer coherent and impulsive at Ku (14.5 GHz) (Fig. 1, left panel) and C (5.4 GHz) (Fig. 1, middle panel) to measure the radar backscatter from the sea surface from fixed positions. Each radar is mounted on a rotating device, able to steer the antenna at the desired azimuth and incidence angle. A ultrasonic anemometer (Fig. 1, right panel) measures the wind components and the air temperature, from which the the wind stress and the sensible heat flux may be obtained. Each radar and the anemometer are part of the same system: data from anemometer are used by the system to steer tha radar upwind at the desired incidence angle.
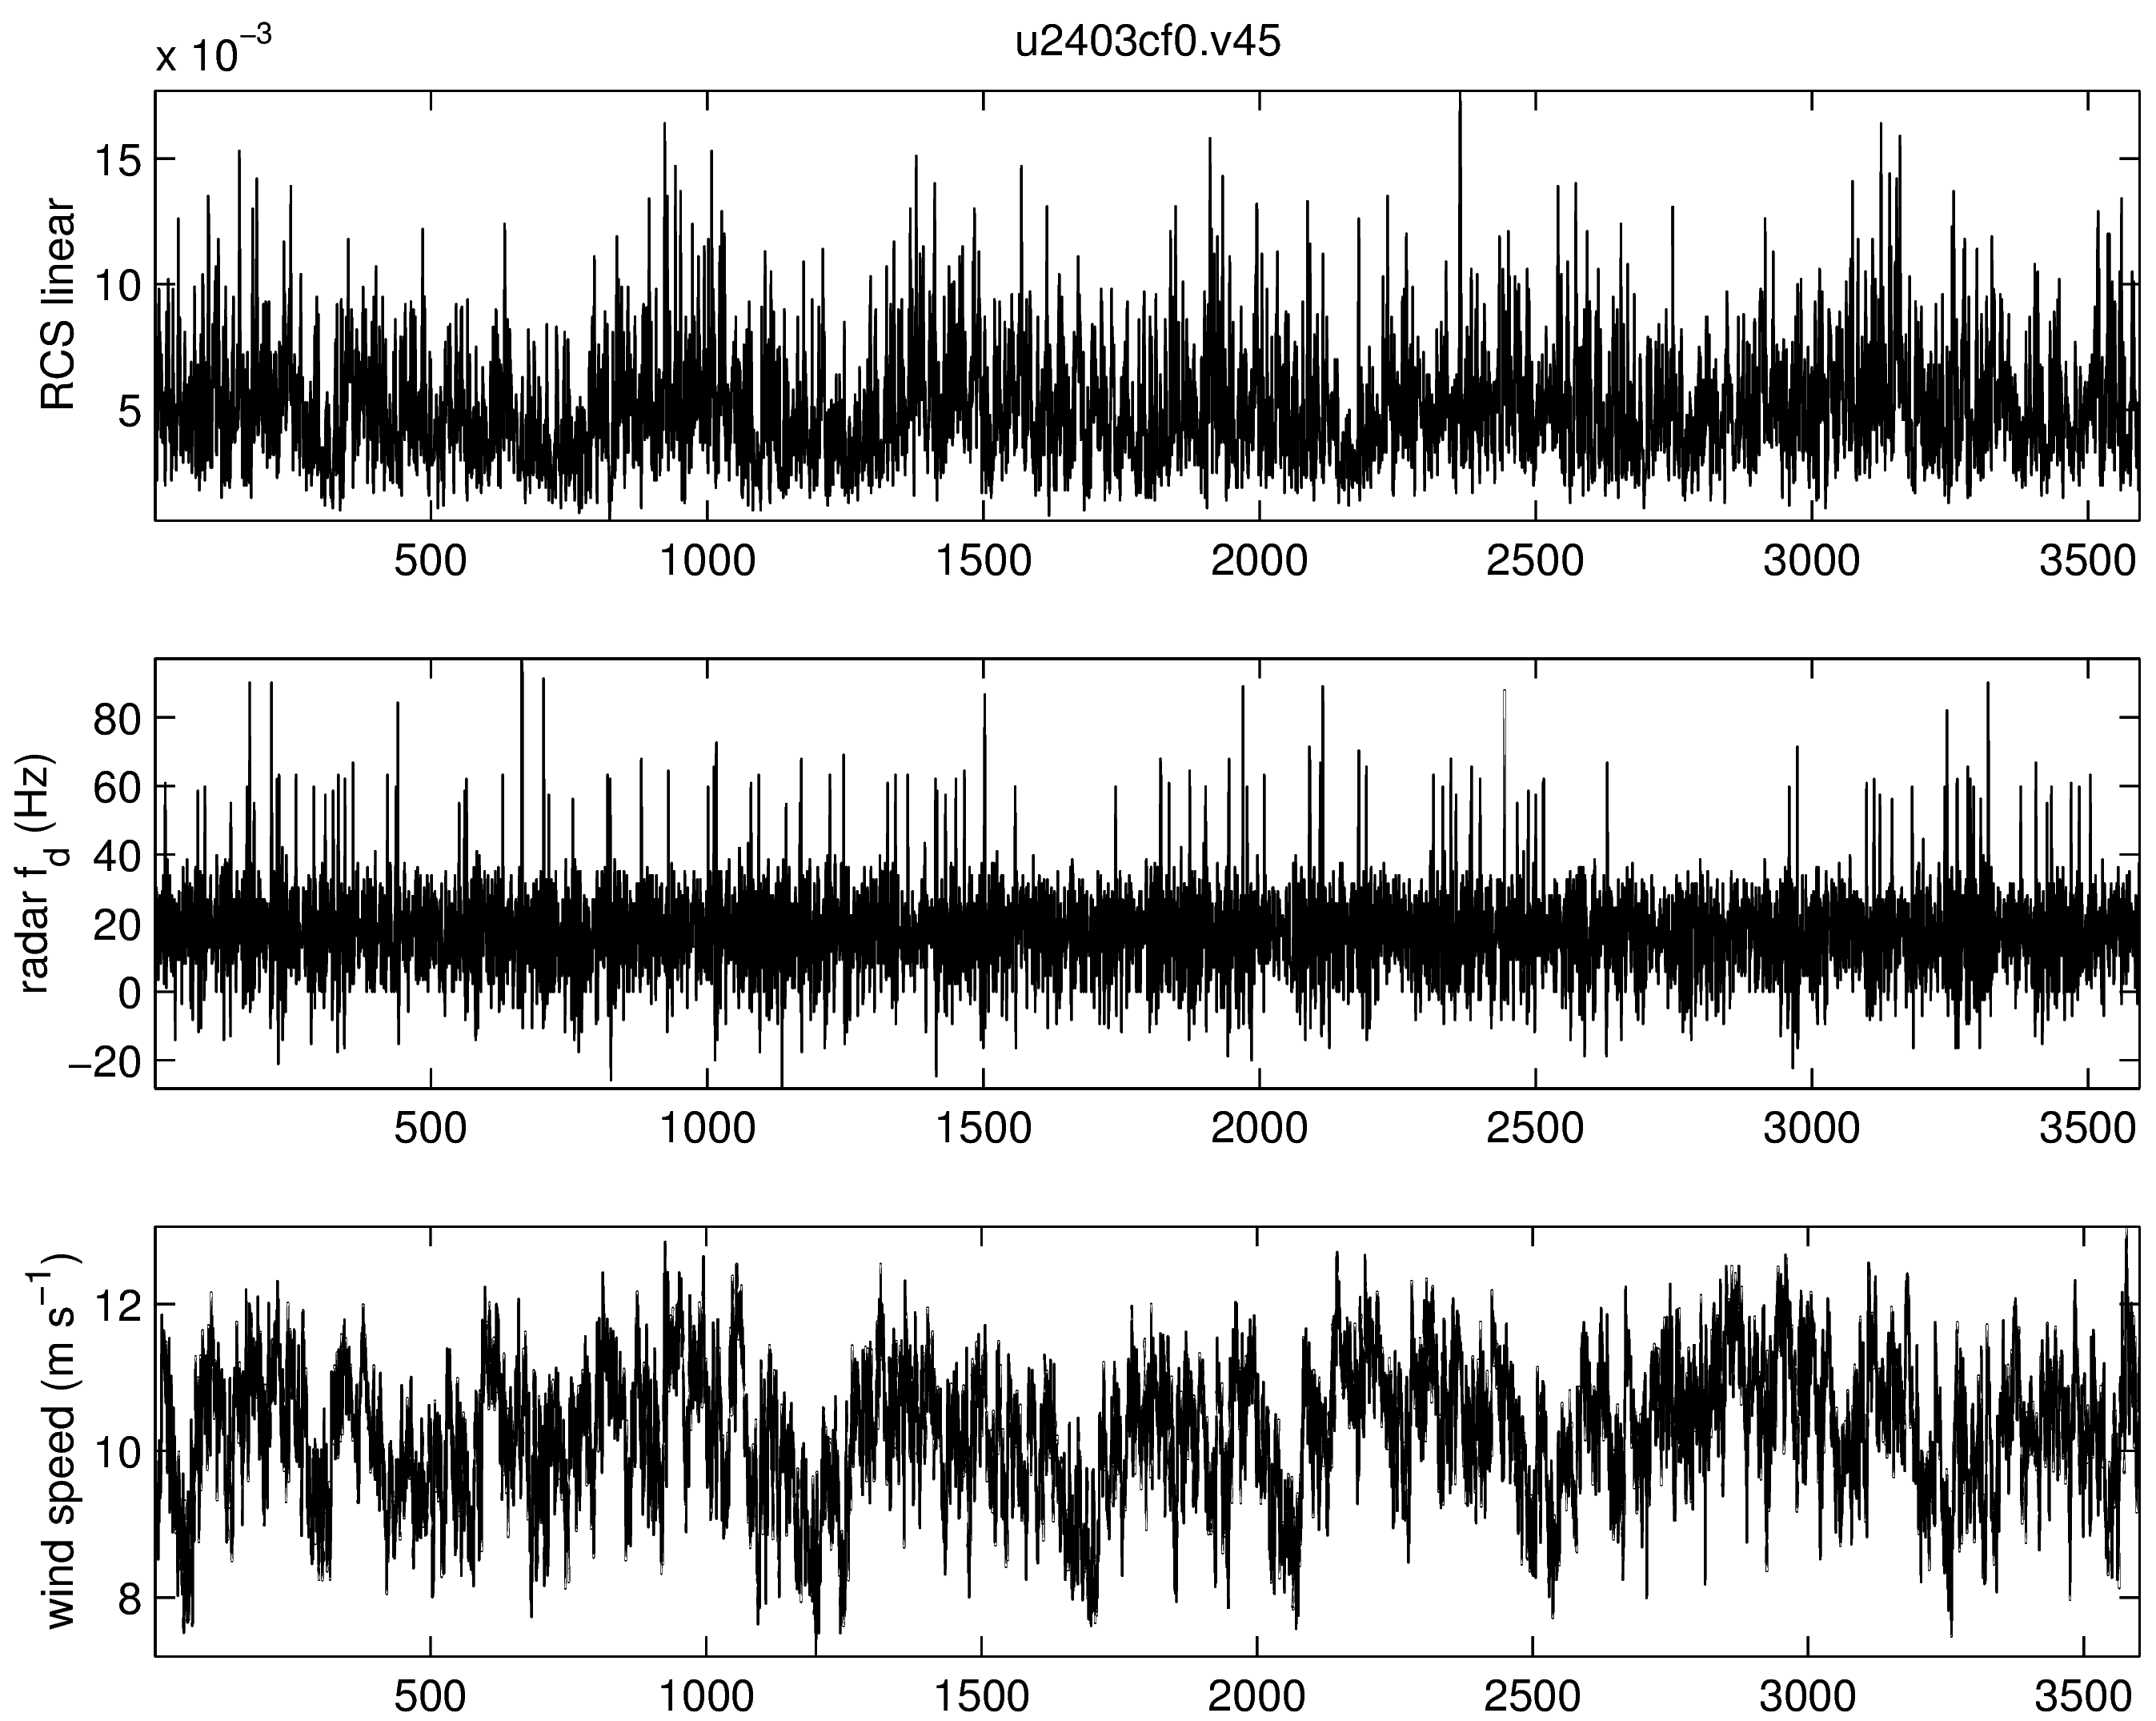
The data recorded consist of simultaneous time series of wind, radar backscatter and radar Doppler frequency obtained from platforms in the open sea. An example of these time series is shown in left panel of Fig. 2: the top panel reports the Radar Cross Section (RCS) in linear units, the middle panel the radar Doppler frequency and the bottom panel the wind speed measured simultaneously to the radar backscatter.
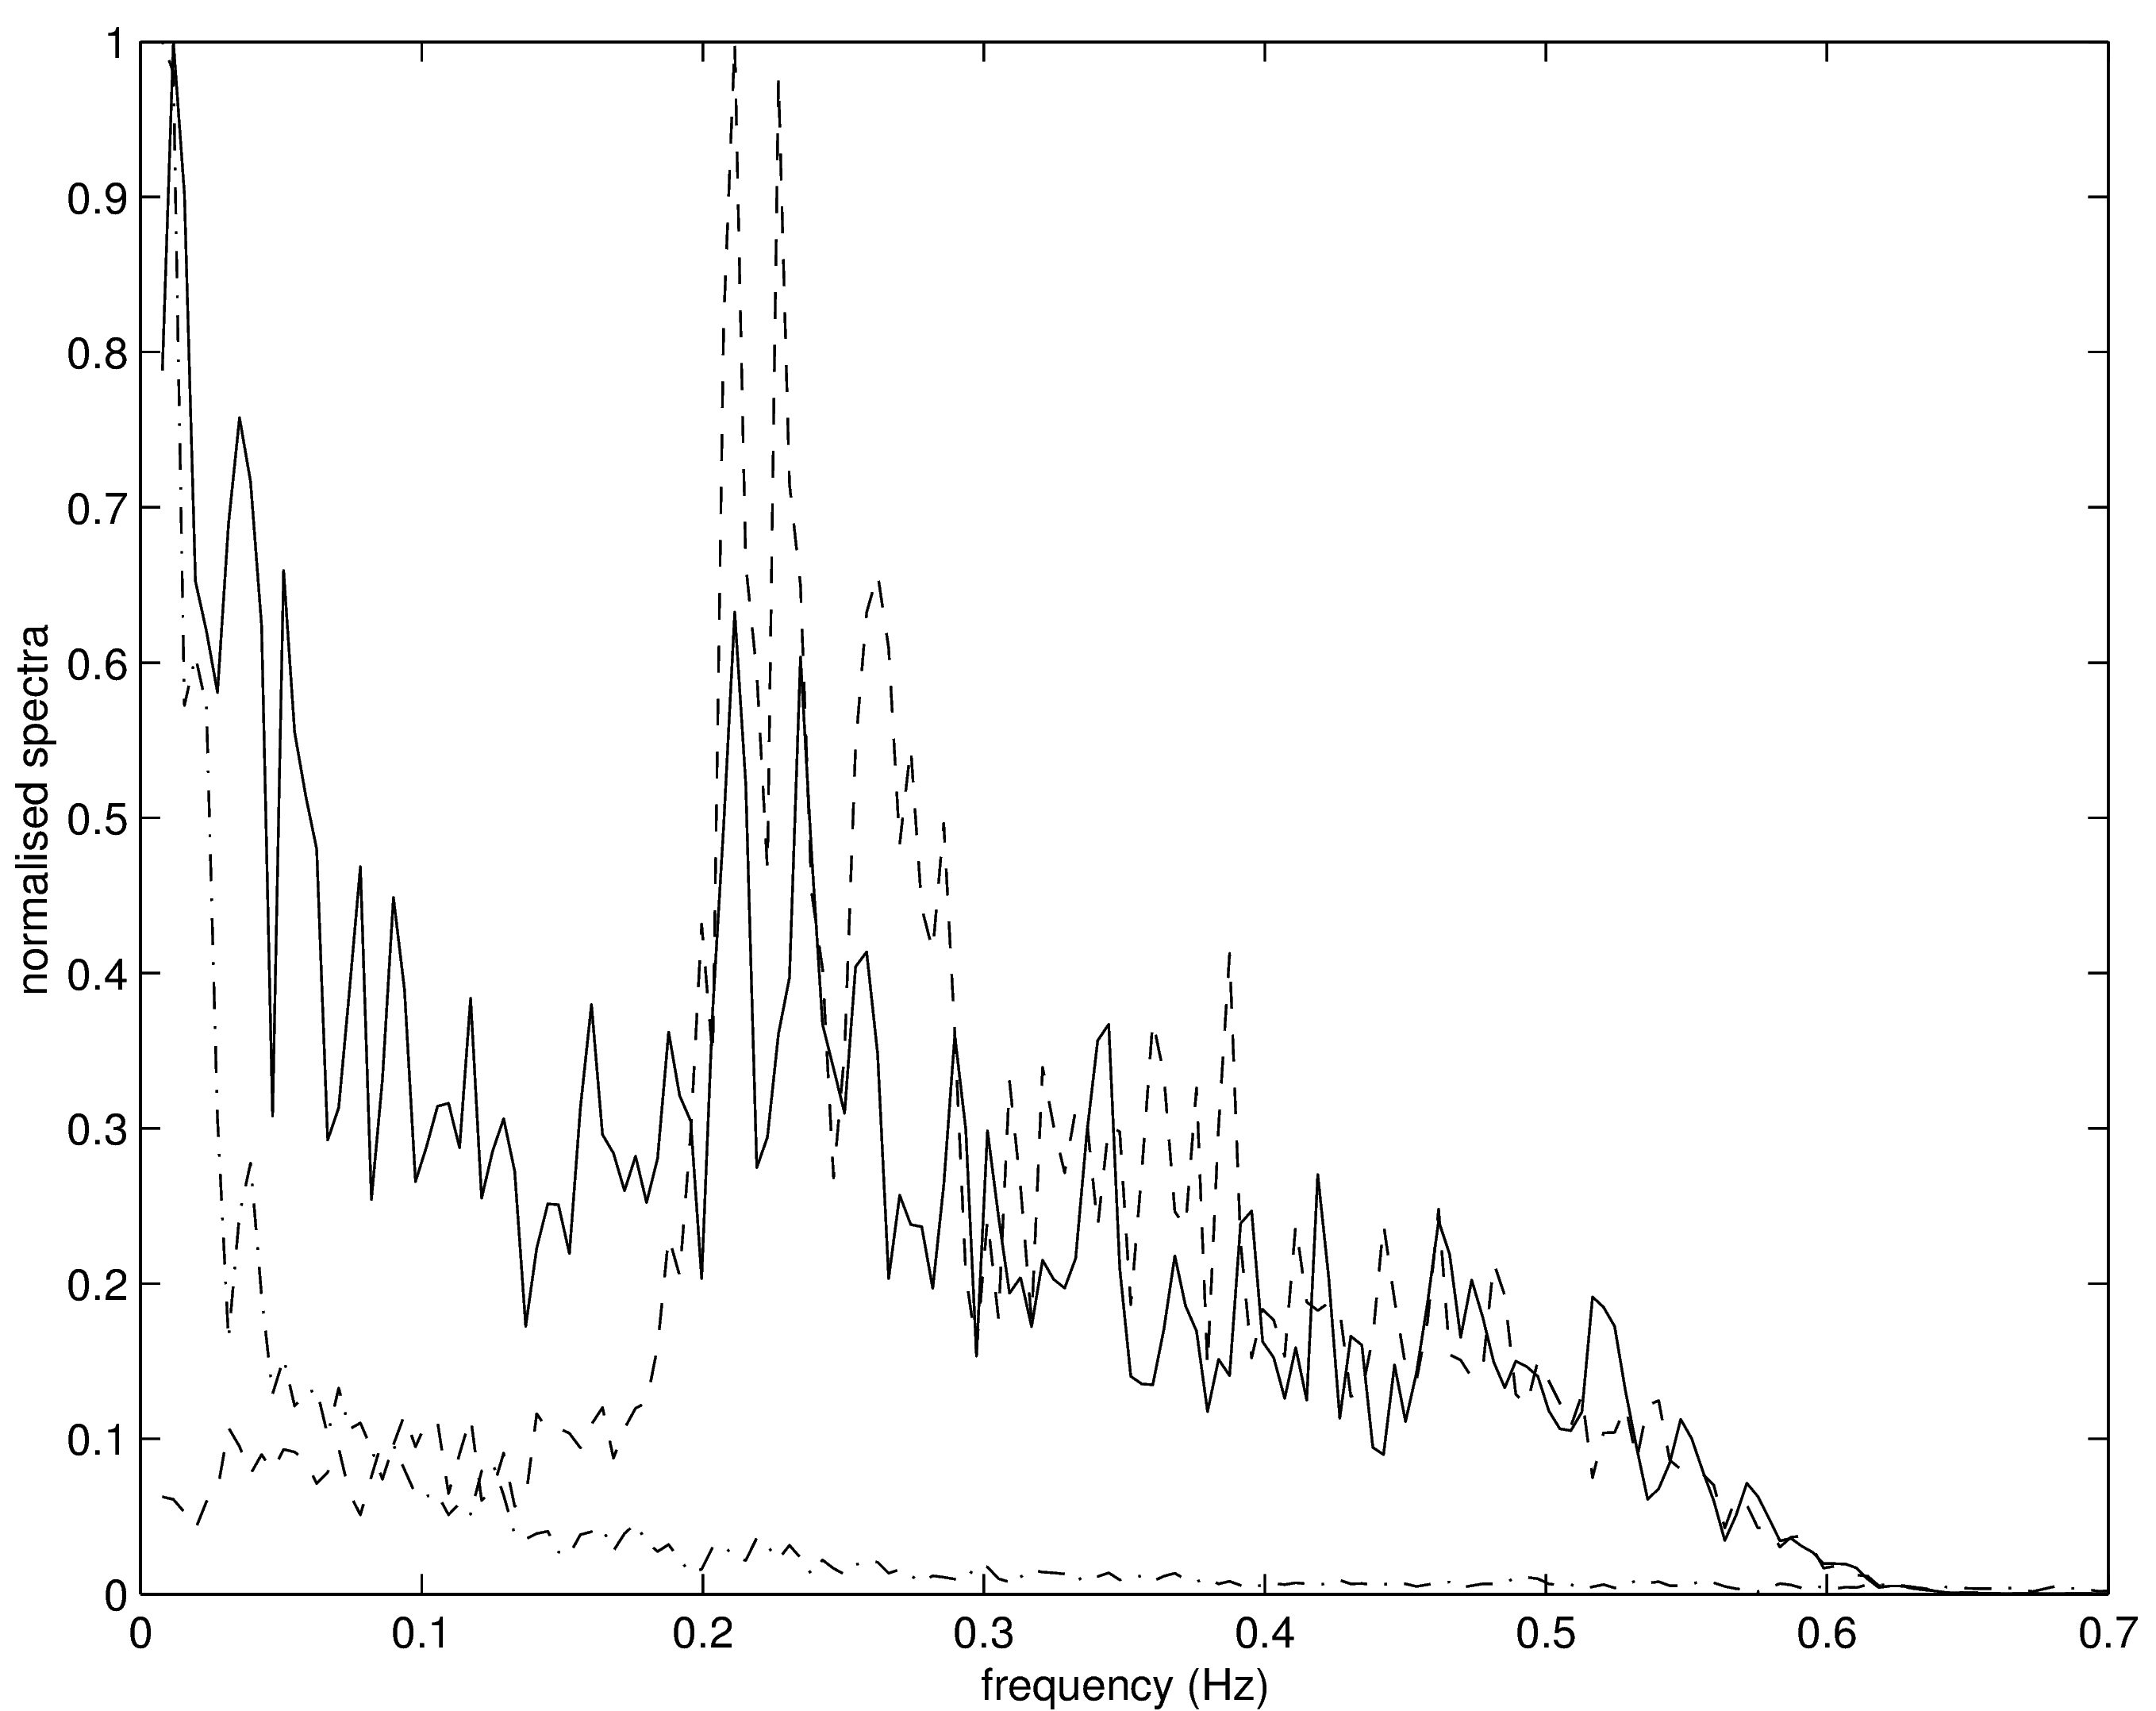
The spectra of the time series are reported in the right panel of Fig. 2: the radar backscatter (solid line) is influenced both by gravity waves and by the wind, hence the two peaks spectrum, with the low frequency one corresponding to the wind. Given its coincidence with the wind spectrum peak (dot-dashed line); the radar Doppler frequency spectrum (dashed line) shows a peak in the gravity waves range.
Selected references
Zecchetto, S., F. Debiasio and P. Trivero,
Local properties of radar backscatter at C-band and off nadir angles
Zecchetto, S. and P. Trivero, Experimental ocean active microwave remote sensing, in Satellite remote sensing of the Oceanic Environment (Jones, Sugimori and Stewart Eds.), Seibutsu Kenkyusha, Tokyo, 115-122, 1993, ISBN 4-915342-10-7
Zecchetto, S., Effects of modulation of sigma naugth with implications for physical scatterometer modelling, in The air-sea interface. Radio and Acoustic Sensing, Turbulence and Wave Dynamics (Donelan, Hui and Plant Eds.), The Rosenstiel School of Marine and Atmospheric Science, University of Miami, USA, 729-733, 1996, ISBN 0-930050-00-2.
Zecchetto, S., F. De Biasio and P. Trivero, Local Properties of Radar Backscatter at C-band and Off-nadir Angles, in The Wind-Driven Air-Sea Interface. Electronic and Acoustic Sensing, Wave Dynamics and Turbulent Fluxes, (M. Banner Ed.), School of Mathematics, The University of New South Wales, Sydney, Australia, 441-448, 1999, ISBN 0 7334 0586 X.